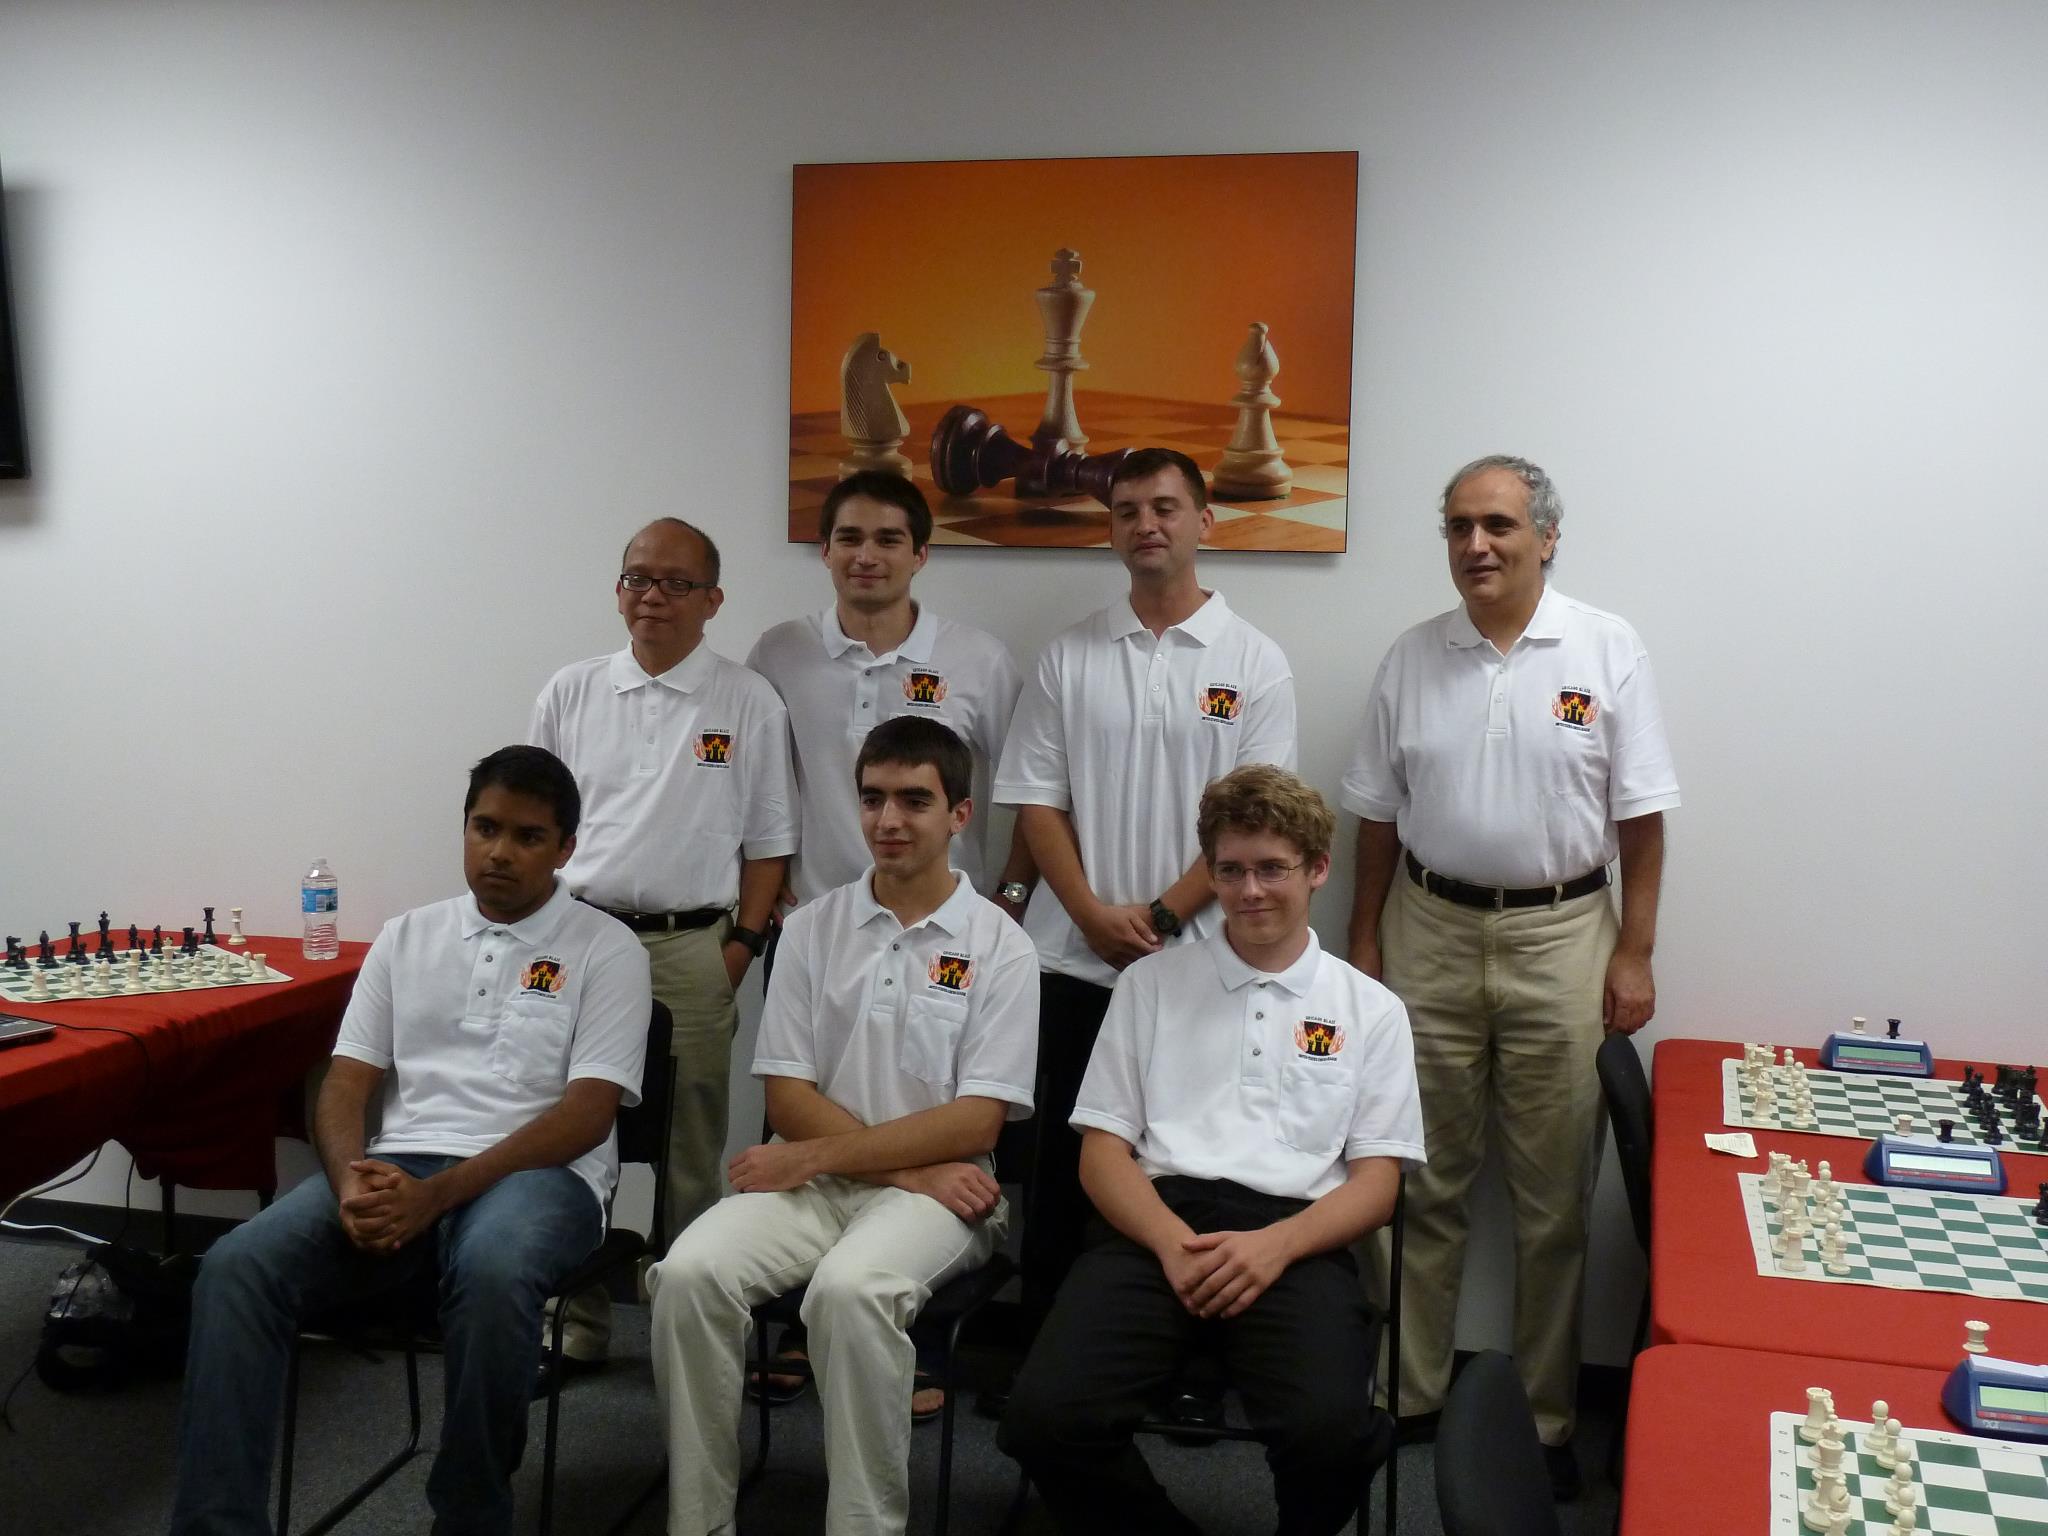
There are a couple of reasons why a team in a match might have an average rating above 2400.75. They are:
1. Each team is allowed to use any rating list from September of the previous year through August of the current year. The ratings shown on the matchup page will all be from August of the current year, thus sometimes resulting in higher ratings than would be legally allowed. This means that the team in question is likely using a different rating list.
2. When a team uses a player rated above 2590, that player only counts as 2590 towards the average rating. For instance if there is a player rated 2650, they will only count as 2590 towards the legal average. However when calculating the actual average, the team rating will of course be higher.
There are a couple of reasons why a team in a match might have an average rating above 2400.75. They are:
1. Each team is allowed to use any rating list from January through August of the current year. The ratings shown on the matchup page will all be from August, thus sometimes resulting in higher ratings than would be legally allowed. This means that the team in question is likely using a different rating list.
2. When a team uses a player rated above 2600, that player only counts as 2600 towards the average rating. For instance if there is a player rated 2650, they will only count as 2600 towards the legal average. However when calculating the actual average, the team rating will of course be higher.
If there is a tie during the regular season as to the finishing order for playoff positioning, the following rules will be used (for instance if two teams are tied for second place with seven match points each). Tiebreak #1 is of course the first tiebreak with the lower ones being used only if all the above tiebreak procedures also result in a tie.
1. Total Team Game Points. Thus winning a match 4 - 0 will give you more tiebreak points than winning a match 3 - 1.
2. Average rating of opponents throughout the season, using the August rating list of that season.
3. Head to Head Results. If you have beaten the opposing team 1.5 - 0.5 during the regular season, you will get the higher seeding.
4. Total Match Points versus Divisional Teams. Thus if Team A went 5.0 - 3.0 in Divisional Matches while Team B went 4.5 - 3.5 then Team A would have the better tiebreaks.
5. Total Game Points versus Divisional Teams
6. Total Game Points from Board 1
7. Total Game Points from Board 2
8. Total Game Points from Board 3
9. Total number of team wins. Thus if one team has a total of twenty five points, with twenty of these points being from wins, whereas another team has a total of twenty five points with only nineteen being from wins, the team with twenty wins has the better tiebreaks.
10. An Armageddon blitz game between chosen members of the teams
If there is a tie between three teams in both match points and game points, we will use the above rules to decide the order amongst the teams. The last resort will be an online blitz game between chosen members of the teams.
If there is a tie during the regular season as to the finishing order for playoff positioning, the following rules will be used (for instance if two teams are tied for second place with seven match points each). Tiebreak #1 is of course the first tiebreak with the lower ones being used only if all the above tiebreak procedures also result in a tie.
1. Total Team Game Points. Thus winning a match 4 - 0 will give you more tiebreak points than winning a match 3 - 1.
2. Strength of Schedule; the team whose opponents have the highest combined record wins the tiebreak.
3. Average rating of opponents throughout the season, using the August rating list of that season.
4. Head to Head Results. If you have beaten the opposing team 1.5 - 0.5 during the regular season, you will get the higher seeding.
5. Total Match Points versus Divisional Teams. Thus if Team A went 5.0 - 3.0 in Divisional Matches while Team B went 4.5 - 3.5 then Team A would have the better tiebreaks.
6. Total Game Points versus Divisional Teams
7. Total Game Points from Board 1
8. Total Game Points from Board 2
9. Total Game Points from Board 3
10. Total number of team wins. Thus if one team has a total of twenty five points, with twenty of these points being from wins, whereas another team has a total of twenty five points with only nineteen being from wins, the team with twenty wins has the better tiebreaks.
11. An Armageddon blitz game between chosen members of the teams
If there is a tie between three teams in both match points and game points, we will use the above rules to decide the order amongst the teams. The last resort will be an online blitz game between chosen members of the teams.
If the regulation match is tied 2 - 2, the following tiebreak procedures will be take place after a ten minute break:
1. The fourth boards from each team will play each other. The team that won on the highest board during the original match will choose their color for the first game. If all regulation games were drawn, the lower rated team gets to choose colors for the first tiebreak game. The time control will be five minutes with a five second increment. The loser of this game will be eliminated, and the winner then faces Board Three of the opposing team.
2. This process continues with the next higher board on each team continually replacing any player of their team who gets eliminated.
3. If a game ends in a draw, both players are eliminated, except if at least one team is using its Board One in which case there is no elimination on a draw, instead colors reverse, and the game is replayed until there is a decisive result.
4. Colors will switch every game for the teams in all circumstances.
5. This process repeats itself until all four players from one team have been eliminated. Thus in order for your opponents to win the match, every one of your team members must be eliminated.
 |
|
2011 Roster (September 2010 Rating List)
• Manager: Daniel Parmet
• Assistant Managers: Jae Lim, Brad Rosen
2011 Schedule
| Week | Date | Color | Opponent | Result |
| 1 | 8/31 | B | Seattle Sluggers | Win 3.5-0.5 |
| 2 | 9/7 | W | Miami Sharks | Win 3.5-0.5 |
| 3 | 9/12 | B | Arizona Scorpions | Win 2.5-1.5 |
| 4 | 9/21 | B | Los Angeles Vibe | Win 3-1 |
| 5 | 9/28 | W | St. Louis Arch Bishops | Win 3.5-0.5 |
| 6 | 10/5 | W | Baltimore Kingfishers | Win 2.5-1.5 |
| 7 | 10/12 | W | San Francisco Mechanics | Win 2.5-1.5 |
| 8 | 10/19 | B | Dallas Destiny | Win 3.5-0.5 |
| 9 | 10/24 | B | Miami Sharks | Loss 2.5-1.5 |
| 10 | 10/31 | W | Arizona Scorpions | Tie 2-2 |
| | | Regular Season Record | 8.5 - 1.5 |
| Quarterfinals | 11/7 | W | Dallas Destiny | Tie 2-2* |
| Semifinals | 11/14 | W | Los Angeles Vibe | Win 2.5-1.5 |
| Championship | 11/20 | W | New York Knights | Loss 2.5-1.5 |
*Chicago advanced due to draw odds
• Click here to see the entire 2011 League Schedule
2010 Roster (September 2009 Rating List)
• Manager: Daniel Parmet
• Assistant Managers: Jae Lim, Brad Rosen
2010 Schedule
| Week | Date | Color | Opponent | Result |
| 1 | 8/23 | B | Seattle Sluggers | Win 2.5-1.5 |
| 2 | 9/1 | W | St. Louis Arch Bishops | Tie 2-2 |
| 3 | 9/8 | W | San Francisco Mechanics | Win 2.5-1.5 |
| 4 | 9/15 | B | Los Angeles Vibe | Loss 3-1 |
| 5 | 9/20 | W | Arizona Scorpions | Win 2.5-1.5 |
| 6 | 9/27 | B | Philadelphia Inventors | Win 2.5-1.5 |
| 7 | 10/6 | B | St. Louis Arch Bishops | Loss 2.5-1.5 |
| 8 | 10/11 | B | Arizona Scorpions | Loss 2.5-1.5 |
| 9 | 10/18 | W | Miami Sharks | Tie 2-2 |
| 10 | 10/27 | W | Dallas Destiny | Win 2.5-1.5 |
| | | Regular Season Record | 6.0 - 4.0 |
| Quarterfinals | 11/3 | B | Miami Sharks | Loss 3-1 |
• Click here to see the entire 2010 League Schedule
2009 Roster (June 2009 Rating List)
• Manager: Glenn Panner
• Assistant Managers: Daniel Parmet, Brad Rosen
2009 Schedule
| Week | Date | Color | Opponent | Result |
| 1 | 9/2 | B | Arizona Scorpions | Loss 3.5-0.5 |
| 2 | 9/9 | W | Miami Sharks | Loss 3-1 |
| 3 | 9/16 | B | Tennessee Tempo | Win 2.5-1.5 |
| 4 | 9/21 | W | San Francisco Mechanics | Loss 2.5-1.5 |
| 5 | 9/30 | B | New Jersey Knockouts | Loss 2.5-1.5 |
| 6 | 10/5 | W | Philadelphia Inventors | Tie 2-2 |
| 7 | 10/14 | W | Tennessee Tempo | Win 2.5-1.5 |
| 8 | 10/19 | W | Arizona Scorpions | Loss 2.5-1.5 |
| 9 | 10/26 | B | Dallas Destiny | Win 3.5-0.5 |
| 10 | 11/4 | B | Seattle Sluggers | Tie 2-2 |
| | | Regular Season Record | 4.0 - 6.0 |
• Click here to see the entire 2009 League Schedule
2008 Roster (August 2008 Rating List)
• Manager: Glenn Panner
• Assistant Managers: Tom Panelas, Brad Rosen
2008 Schedule
| Week | Date | Color | Opponent | Result |
| 1 | 8/25 | B | Arizona Scorpions | Loss 2.5-1.5 |
| 2 | 9/3 | W | San Francisco Mechanics | Tie 2-2 |
| 3 | 9/10 | W | Tennessee Tempo | Win 4-0 |
| 4 | 9/15 | B | Seattle Sluggers | Loss 2.5-1.5 |
| 5 | 9/24 | B | Baltimore Kingfishers | Win 2.5-1.5 |
| 6 | 10/1 | W | Miami Sharks | Tie 2-2 |
| 7 | 10/8 | B | Tennessee Tempo | Win 2.5-1.5 |
| 8 | 10/15 | W | Queens Pioneers | Loss 3-1 |
| 9 | 10/22 | W | Arizona Scorpions | Loss 3-1 |
| 10 | 10/29 | B | Dallas Destiny | Loss 2.5-1.5 |
| | | Regular Season Record | 4.0 - 6.0 |
• Click here to see the entire 2008 League Schedule
Rosters & Schedules by Year
2011 |
2010 |
2009 |
2008
Chicago's Historical Results
2011: 8.0 – 2.0, 1st Place in the Western Division. Lost 2.5 - 1.5 in Championship to New York
2010: 6.0 – 4.0, 2nd Place in the Western Division. Lost 3 - 1 in Quarterfinals to Miami
2009: 4.0 – 6.0, 5th Place in the Western Division. Failed to qualify for the Playoffs
2008: 4.0 – 6.0, 6th Place in the Western Division. Failed to qualify for the Playoffs
Stats at end of 2011 Season
| Overall Record vs USCL Teams | Match Points | Game Points |
| Arizona Scorpions | 2.5/8 (31%) | 13.0/32 (41%) |
| Baltimore Kingfishers | 2.0/2 (100%) | 5.0/8 (63%) |
| Boston Blitz | Never Played | Never Played |
| Carolina Cobras | Never Played | Never Played |
| Connecticut Dreadnoughts | Never Played | Never Played |
| Dallas Destiny | 3.5/5 (70%) | 13.0/20 (65%) |
| Los Angeles Vibe | 2.0/3 (67%) | 6.5/12 (54%) |
| Manhattan Applesauce | 0.0/1 (0%) | 1.0/4 (25%) |
| Miami Sharks | 2.0/6 (33%) | 11.0/24 (46%) |
| New England Nor'easters | Never Played | Never Played |
| New Jersey Knockouts | 0.0/1 (0%) | 1.5/4 (38%) |
| New York Knights | 0.0/1 (0%) | 1.5/4 (38%) |
| Philadelphia Inventors | 1.5/2 (75%) | 4.5/8 (56%) |
| San Francisco Mechanics | 2.5/4 (63%) | 8.5/16 (53%) |
| Seattle Sluggers | 2.5/4 (63%) | 9.5/16 (59%) |
| St. Louis Arch Bishops | 1.5/3 (50%) | 7.0/12 (58%) |
| Tennessee Tempo | 4.0/4 (100%) | 11.5/16 (72%) |